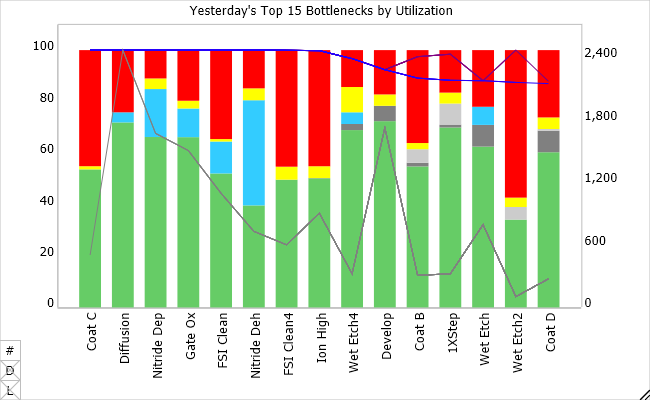
Tool State Pareto Chart
View your recent bottlenecks by using the Tool State Pareto Chart, sliced by tool group (as shown), or by tool. Your logged tool states are mapped, by site, to the SEMI E10 standard states. FabTime also breaks down tool idle time according to whether or not WIP was available that could have been run at that time. Use this chart to identify capacity bottlenecks and to understand tools that contribute to cycle time problems.